What the web is made of: category shares across 20 million domains
How big is the adult web, really? How much does a family preset take away? For product teams sizing a filter, a report or a dataset, and for admins who want to know what a preset really blocks, here is how the 20 million most visited domains split by category.
The 20 largest categories
Share of the 20.1 million categorized domains that carry each category. A domain with two categories counts in both, so the shares add up to more than 100%.
Size every category from the file you license
The shares on this page come from the same categorized domains we deliver to licence holders. With the file in your own systems, you can count any category, popularity band or country yourself, at any time.
- Size an on-device list before you build it.
- Estimate how many domains a new setting will touch.
- Rebuild the figures after every refresh delivery.
Main purpose or any mention: two ways to count
Counting only a domain's first category, its main purpose, gives smaller numbers for categories that often appear as a side label. The gap shows how much of a category lives inside other kinds of sites.
| Category | Main category | Any category | What the gap says |
|---|---|---|---|
| Business | 16.3% | 22.5% | Often the second label of trade and service sites |
| Arts & Entertainment | 9.8% | 11.6% | Mostly a main purpose |
| Health & Medicine | 8.6% | 9.9% | Mostly a main purpose |
| Shopping | 7.0% | 12.0% | Many sites sell something next to their main topic |
| Education/Reference | 4.9% | 8.9% | Guides and learning sections inside other sites |
| Restaurants & Dining | 1.7% | 4.3% | Usually paired with Food & Drink |
| Adult | 1.1% | 1.1% | Almost never a side label |
| Gambling | 2.0% | 2.1% | Almost always the main purpose when present |
How much of the web a preset really blocks
Share of the 20 million domains that carry at least one category of each preset. Popular sites are slightly more likely to be caught.
Library preset
Adult, VPN / Proxy / Anonymizers1.60% of the top 1 million. About 233,000 domains in the 20 million.
Family set
12 safety categories5.37% of the top 1 million. About 921,000 domains: Adult, Gambling, Weapons, Illegal Drugs, Violence, Hate, VPN, Dating, Alcohol, Tobacco, Lingerie, File Sharing.
Productivity set
Social, Streaming, Gaming, Shopping16.2% of the top 1 million. About 3 million domains, mostly because of Shopping.
Blocking on the main category only shrinks the family set from 4.58% to 4.19%, about 78,000 fewer domains. That difference is the set of sites where a safety category is a side label, which is exactly where strict and lenient settings disagree. See multi-category websites for the detail.
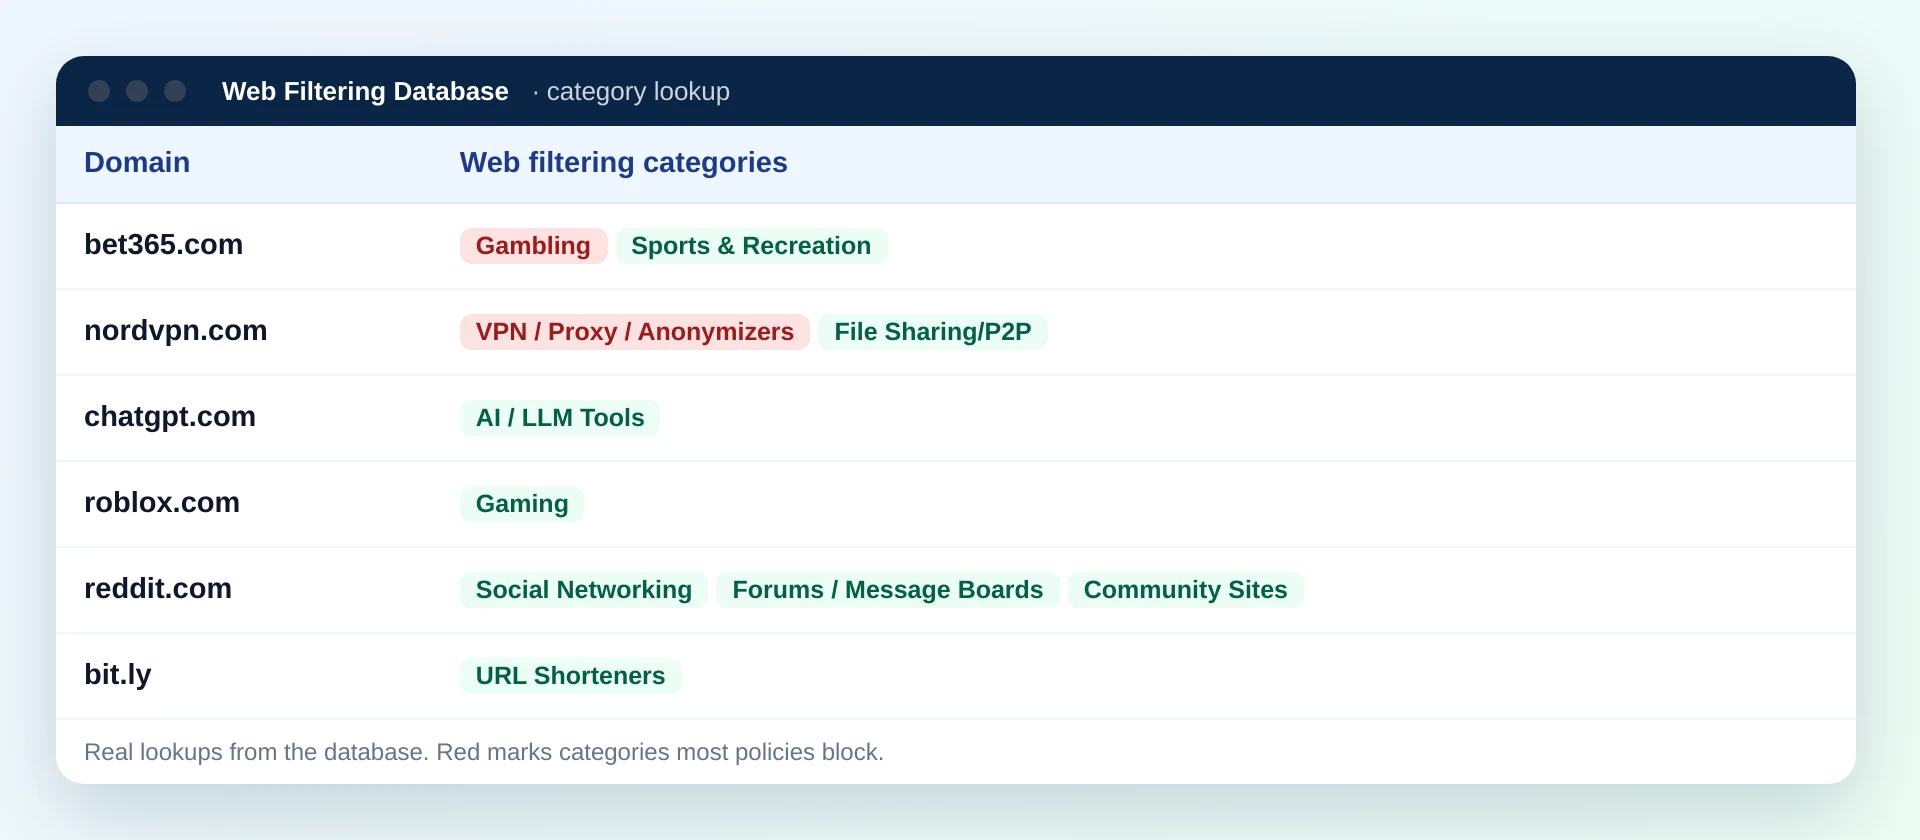
Six well-known domains, each the face of a category on this page
These rows are real lookups. The right column repeats that category's share of the 20 million, so you can see the row and the total side by side.
| Domain | Categories stored | Share of the 20M for that category |
|---|---|---|
| booking.com | Travel | Travel: 4.7% |
| zillow.com | Real Estate | Real Estate: 3.0% |
| mayoclinic.org | Health & Medicine | Health & Medicine: 9.9% |
| coursera.org | Education/Reference | Education/Reference: 8.9% |
| bbc.co.uk | News/Media | News/Media: 2.0% |
| nasa.gov | Science | Science: 1.0% |
Categories that crowd the top of the ranking
Share of each popularity band that carries the category. A test on well-known sites sees noticeably more news, streaming and adult content than the long tail does.
| Category | Top 1 million | 5 to 20 million | Ratio |
|---|---|---|---|
| File Sharing/P2P | 0.08% | 0.04% | 2.0× |
| Online Banking | 0.26% | 0.14% | 1.9× |
| Streaming Media | 0.75% | 0.42% | 1.8× |
| Forums / Message Boards | 0.31% | 0.18% | 1.7× |
| News/Media | 3.01% | 1.96% | 1.5× |
| Adult | 1.54% | 1.07% | 1.4× |
| Political | 1.37% | 1.04% | 1.3× |
| Gaming | 2.47% | 2.05% | 1.2× |
| Gambling | 2.42% | 2.09% | 1.2× |
| Computers & Technology | 8.75% | 9.54% | 0.9× |
Practical consequence: a filter that looks accurate on a list of famous sites can still miss in the long tail, where Business and Computers & Technology sites make up a larger share. Test on both.
Top-level domains: where the web lives
The most common endings among the 20 million categorized domains, and the endings that stand out inside single categories.
| Category | Ending that stands out | Share of the category | Rank among its endings |
|---|---|---|---|
| AI / LLM Tools | .ai | 11.9% | Second after .com |
| URL Shorteners | .link | 9.1% | Second after .com |
| Developer Tools / Code Hosting | .dev | 8.7% | Second after .com |
| Cryptocurrency | .io | 4.9% | Second after .com |
| Web-based Applications | .app | 3.7% | Fourth |
| Streaming Media | .tv | 3.4% | Fourth |
| Cloud Storage / File Hosting | .cloud | 3.2% | Fourth |
| Gambling | .vip | 1.8% | Fourth |
Even where an ending stands out, it holds at most about one domain in eight of the category, usually far behind .com. Blocking an ending catches a small part of a category and many unrelated sites, which is why category data, not endings, should drive the rule.
How licence holders keep these figures current
Category counts move every day as about 300,000 newly registered domains receive a category and scheduled refreshes update the rest. Licence holders receive the files with each delivery, so their own counts are always based on the latest data rather than on this snapshot.
How teams use category shares
The numbers are not trivia. Each of these decisions gets easier with a real count.
Sizing on-device lists
A family set of about 921,000 domains in the top 20 million tells a router team whether it fits in memory or needs a cloud lookup.
Setting customer expectations
"Our strict preset blocks about 1 in 20 popular domains" is a sentence a support team can stand behind.
Reading reports
A report led by Business and Shopping sites mirrors the web's own mix of domains. It is a baseline, not a sign of a problem.
Sampling for research
Researchers drawing a sample by category need the base rates to weight their results correctly.
The smaller categories, by number of domains
Below the top 20, categories get small by count. Small by count is not small by traffic: some of the most visited sites on the web sit in categories with fewer than 100,000 domains.
| Category | Domains | Share | Category | Domains | Share |
|---|---|---|---|---|---|
| Gambling | 425,075 | 2.11% | Email and Messaging | 48,433 | 0.24% |
| Gaming | 418,934 | 2.08% | Dating | 38,937 | 0.19% |
| News/Media | 401,650 | 2.00% | Forums / Message Boards | 37,853 | 0.19% |
| Parked / For-Sale Domains | 360,157 | 1.79% | Online Banking | 30,149 | 0.15% |
| Adult | 222,358 | 1.11% | Weapons | 29,568 | 0.15% |
| Alcohol | 154,272 | 0.77% | Illegal Drugs | 16,345 | 0.08% |
| Social Networking | 92,364 | 0.46% | Tobacco | 14,989 | 0.07% |
| Streaming Media | 89,754 | 0.45% | VPN / Proxy / Anonymizers | 10,988 | 0.05% |
| Podcasts | 76,433 | 0.38% | File Sharing/P2P | 8,028 | 0.04% |
| Freeware/Software | 65,313 | 0.32% | URL Shorteners | 6,255 | 0.03% |
Five things in the numbers that surprise people
Each of these has come up in conversations with product teams who assumed the opposite.
Gambling outnumbers Adult
425,075 gambling domains against 222,358 adult ones. Betting operators open new domains constantly, and it shows in the count.
Parked domains rival Adult
360,157 domains in the top 20 million are parked or for sale. They carry ads and redirects, and many filters still let them through.
Social is tiny by count
Only 92,364 domains carry Social Networking, yet the category holds some of the most visited sites of all.
The bypass categories are short
VPN, proxy, file sharing and URL shortener domains together number about 25,000. Short lists that change fast are where daily updates matter most.
One more: Remote Access Tools holds only 1,785 domains in the top 20 million. A list that short is easy to underrate, yet tech-support scams depend on exactly these tools. See how to block remote access tools.
What the numbers count
The scope behind every figure on this page.
Domains: the 20 million most visited registrable domains; 20,108,566 of them carry at least one web filtering category.
Version: our web filtering file dated 17 October 2026.
Any category: a domain counts in each category it carries, so shares add up to more than 100%.
Main category: the first category of a domain, ranked by how much of the site it describes.
Popularity bands: by position in the ranking: first million, next four million, the remaining fifteen million.
Endings: the last part of the domain name, so .co.uk and .org.uk both count as .uk.
Guessing a category's size, or counting it in the file
Where a real count changes the decision.
| Decision | Without the data | With the licensed file |
|---|---|---|
| Will the preset fit on the device? | Estimate from a public list of unknown age | Count the categories in your tier, today |
| How strict is "strict"? | A feeling from testing famous sites | The share of domains each setting touches |
| Is this report unusual? | No baseline to compare with | The web's own mix by category and band |
| Does an ending matter? | Block the ending and hope | See how much of a category it really holds |
| Keeping figures current | Re-research every few months | Recount after each refresh delivery |
Category shares: frequently asked questions
What is the most common website category?
Business. It appears on 22.5% of the 20 million most visited domains in our data, and it is the main category of 16.3% of them.
What share of websites are adult sites?
About 1.1% of the 20 million most visited domains carry the Adult category in our data, rising to 1.5% among the top 1 million.
How much of the web does a family filter preset block?
A preset of 12 safety categories such as Adult, Gambling, Weapons, Illegal Drugs and VPN services touches 4.6% of the 20 million most visited domains, and 5.4% of the top 1 million.
How many of the most visited domains end in .com?
44.8% of the 20 million most visited domains with a category end in .com. The next largest endings are .de with 7.1%, .org with 4.0% and .uk with 3.0%.
How many popular domains are parked or for sale?
360,157 of the 20 million most visited domains carry the Parked / For-Sale Domains category in our data, 1.8% of the total. That is more than the number of adult domains in the same set.
Why do shares differ between popular and less popular sites?
The most visited sites include more news, streaming, banking and adult services, because those draw large audiences. The long tail holds more business and technology sites, so a test on famous sites alone gives a skewed picture.
Should a filter block whole top-level domains?
Rarely. Some endings are common in one category, such as .ai for AI tools, but even there most domains of the category use .com, and many sites on the same ending belong elsewhere.
Database licences start at $999 for the 1 million most popular domains and grow to the full 120 million, and OEM licences are quoted per deployment. Each tier lets you count categories yourself, as on this page.
Work with the full counts, not a snapshot
Tell us what you need to size: a preset, an on-device list, a report or a research sample. We will suggest the tier and delivery that fit.